


Global crude oil prices closed lower on Monday’s trading session (June 30, 2025), while gasoline prices recorded a slight gain. WTI crude oil contracts for August delivery fell 0.63%, or 41 cents, to around $64.61 per barrel. Conversely, RBOB gasoline contracts for the same month rose 0.13%.
The main pressure on oil prices stems from expectations that OPEC+ will raise production by 411,000 barrels per day (bpd) at its upcoming meeting this weekend. The plan to increase output is reportedly supported by Russia and Saudi Arabia, who view it as a strategy to push prices lower and discipline OPEC+ members exceeding production quotas, such as Kazakhstan and Iraq.
Statements from U.S. President Donald Trump further weighed on oil prices. Trump said he was open to easing sanctions on Iran if the country demonstrated peaceful intentions, raising concerns that Iranian oil supply could return to global markets.
Nevertheless, the decline in oil prices remained limited due to several supportive factors. One was the weakening of the U.S. dollar, which hit its lowest level in more than three years, making dollar-denominated commodities more affordable for global buyers. In addition, the S&P 500 index reached a new record high, reflecting optimism toward the economic outlook, which indirectly supports energy demand.
On the flip side, market sentiment was also dampened by disappointing U.S. economic data. The Chicago Manufacturing Index (PMI) for June dropped to 40.4, the lowest level in five months, while the Dallas Fed Manufacturing Outlook survey remained in negative territory.
Meanwhile, gasoline prices found support from projections of strong demand during the U.S. Independence Day holiday. According to the American Automobile Association (AAA), around 61.6 million people are expected to travel by road from June 28 to July 6, a 2.2% increase from last year, indicating heightened gasoline consumption.
On the supply side, Vortexa data showed that the volume of oil stored on idle tankers for more than seven days fell by 8.7% weekly to 80.22 million barrels as of June 27. Additionally, weekly EIA reports showed that U.S. crude oil, gasoline, and distillate inventories were all below their five-year seasonal averages. U.S. oil production remains steady at 13.435 million bpd, just below record highs. The number of active oil rigs in the U.S. also declined by six units to 432 rigs, the lowest in nearly four years.
Overall, the oil market is currently caught between concerns over oversupply and signs of growing demand, particularly in the transportation sector. The development of OPEC+ policies and upcoming U.S. trade tariff decisions will be critical in determining the next direction for oil prices.
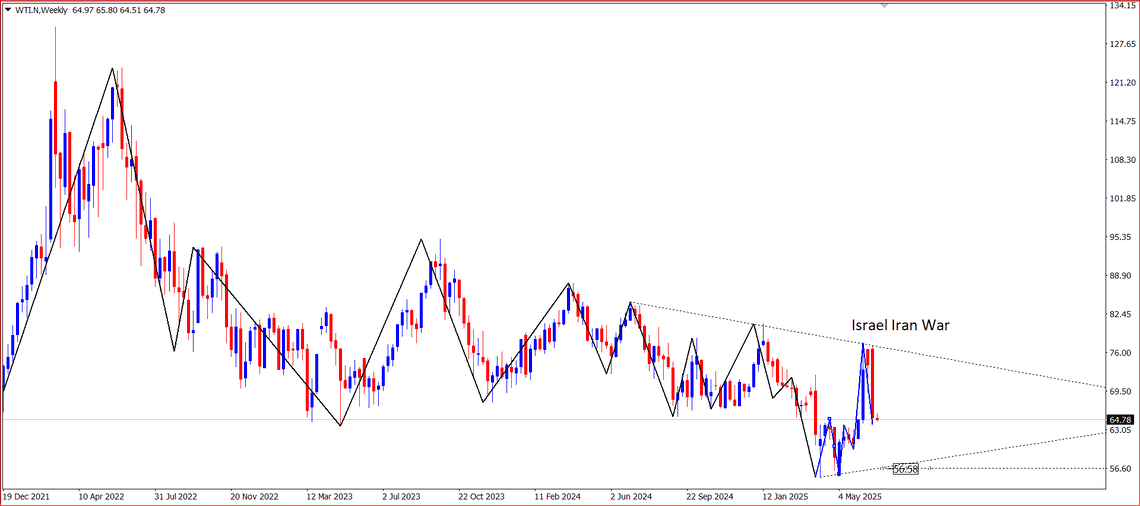
Weekly Oil Chart Review
Technically, oil failed to break through the downtrend trendline resistance around $78 per barrel and the weekly resistance level of $80.77 during the Israel-Iran conflict two weeks ago. This has led investors to start unwinding long positions in this commodity.
Currently, oil is expected to trade within a range of around $68 — a key short-term upward slope — and $72, which represents the 61.8% Fibonacci retracement level from the post-geopolitical spike. On the downside, the price range is seen near $57, aligning with the medium-term uptrend triangle formation. Weekly support levels are gradually positioned at $55.1 and $51.4, while the nearest resistance levels lie at $66 and $78.
Disclaimer: Trading involves risk.