


Chart Pattern
Chart patterns are visual formations created by price movements on a chart over a certain period. These patterns result from the repeated buying and selling actions of traders, forming recognizable structures that can be used to predict future price directions.
Chart patterns are used by technical traders to:
- Determine potential trend reversals or continuations
- Develop entry and exit strategies
- Understand market psychology through price movement
General Categories of Chart Patterns
Chart patterns are generally divided into two main categories:
- Reversal Patterns
Patterns that indicate a possible reversal in trend direction, such as from bullish to bearish or vice versa. - Continuation Patterns
Patterns that suggest the current trend is likely to continue after the pattern is completed.
Reversal Chart Patterns
Head and Shoulders
The Head and Shoulders pattern is a reversal chart pattern that signals a potential change in trend from bullish to bearish. It reflects market exhaustion in pushing prices higher and is often considered a strong signal for trend reversal.
Structure of the Head and Shoulders Pattern:
- Left Shoulder: Price rises then falls, forming the first peak.
- Head: Price rises higher than the first peak, then falls again — the highest point.
- Right Shoulder: Price rises again but only to around the same level as the left shoulder, then falls.
- Neckline: A line connecting the two troughs between the three peaks — this is the key line for confirming a reversal signal.
Head and Shoulders Top
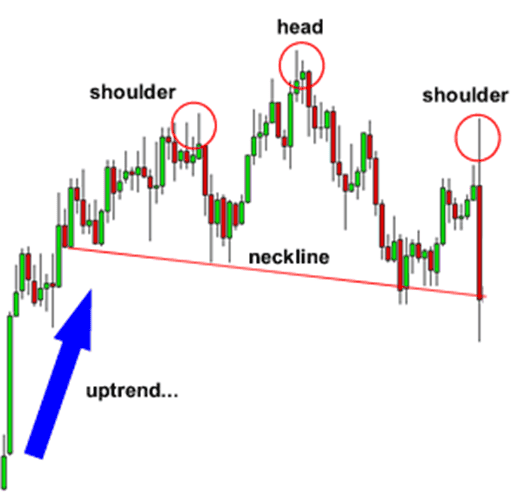
- A three-peak pattern, with the middle peak (head) being higher than the two side peaks (shoulders).
- Signal: Reversal from bullish to bearish.
- Entry: Sell when the price breaks below the neckline.
Head and Shoulders Bottom
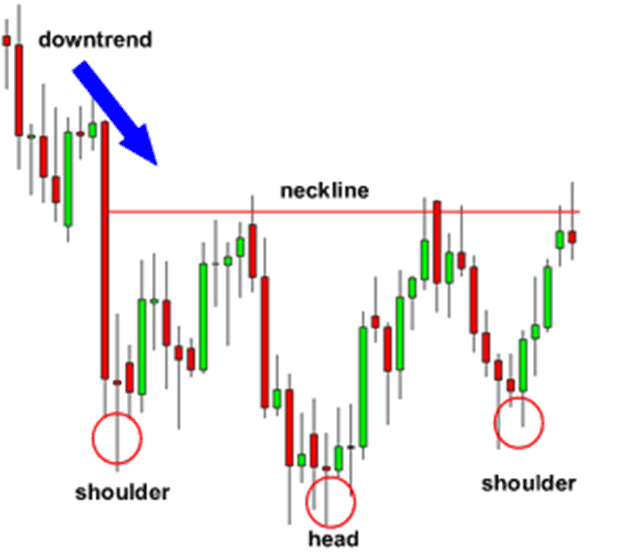
- A three-trough pattern, with the middle trough (head) being lower than the shoulders.
- Signal: Reversal from bearish to bullish.
- Entry: Buy when the price breaks above the neckline.
Double Top & Double Bottom
Double Top
Definition:
The Double Top is a chart pattern indicating a possible trend reversal from bullish to bearish. It forms when the price makes two peaks at approximately the same level but fails to break resistance, indicating weakening buying power.
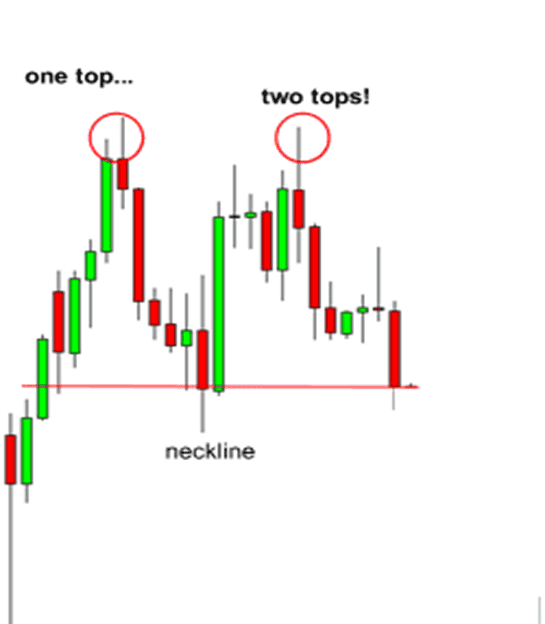
- Double Top: Two parallel peaks → bearish signal
- Entry: Breakout below the support/resistance line between the peaks/valley
Structure of the Pattern:
- First Peak: Price rises and forms a peak, then pulls back.
- Pullback/Support: Price drops to a support area (the valley between the peaks).
- Second Peak: Price attempts to rise again but fails to break the first peak.
- Neckline: Support level formed at the base between the two peaks.
- Breakout: When the price breaks below the neckline → bearish confirmation.
Entry & Exit Strategy:
- Sell Entry: When the price breaks below the neckline
- Take Profit (TP): Measure the distance from the peak to the neckline, projected downward from the breakout point
- Stop Loss (SL): Just above the second peak
Pattern Psychology:
- First peak: Buyers dominate
- Second peak: Buyers lose strength
- Break of neckline: Sellers take control
Double Bottom
Definition:
The Double Bottom is a chart pattern indicating a trend reversal from bearish to bullish. It forms when the price creates two troughs at nearly the same level but fails to break support, showing weakening selling pressure.
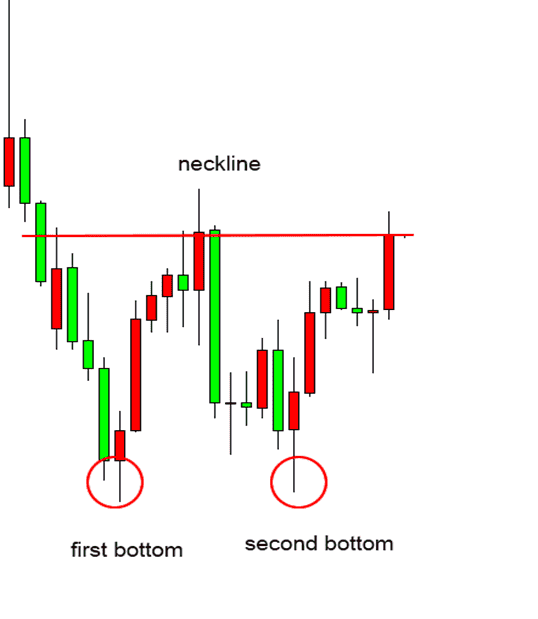
- Double Bottom: Two parallel troughs → bullish signal
- Entry: Breakout above the resistance line between the troughs/peak
Structure of the Pattern:
- First Trough: Price falls and forms a bottom, then rises slightly.
- Pullback/Resistance: Price rises to a resistance area (the peak between the troughs).
- Second Trough: Price falls again but fails to make a new lower low.
- Neckline: Resistance level between the two troughs.
- Breakout: When the price breaks above the neckline → bullish confirmation.
Entry & Exit Strategy:
- Buy Entry: When the price breaks above the neckline
- Take Profit (TP): Distance between the trough and neckline, projected upward
- Stop Loss (SL): Below the second trough
Pattern Psychology:
- First trough: Sellers dominate
- Second trough: Sellers weaken, buyers enter
- Break of neckline: Buyers take control of the market
The best investment is an investment in knowledge. Start your journey to trading success with a Masterclass Trading Webinar every Friday. Join now!