


In the world of trading, be it stocks, forex, or commodities like gold, understanding support, resistance, and trendlines is very important. These three elements are the foundation of technical analysis that traders use to make entry and exit decisions.
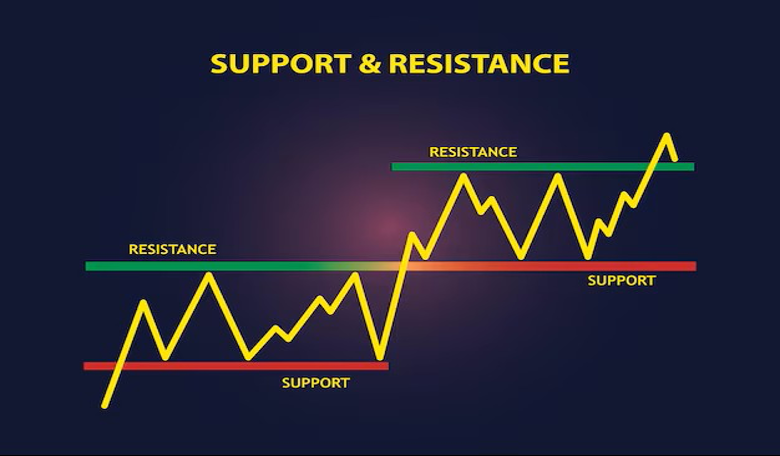
🔹 What is Support?
Support is a price level where demand is expected to be strong enough to stop or reverse a price decline. When the price drops close to the support area, usually many buyers enter, so the price has the potential to bounce up.
Characteristics of Support:
- Occurs in the area of the previous low.
- Prices often bounce several times from this level.
- If the support is broken, it can turn into a new resistance.
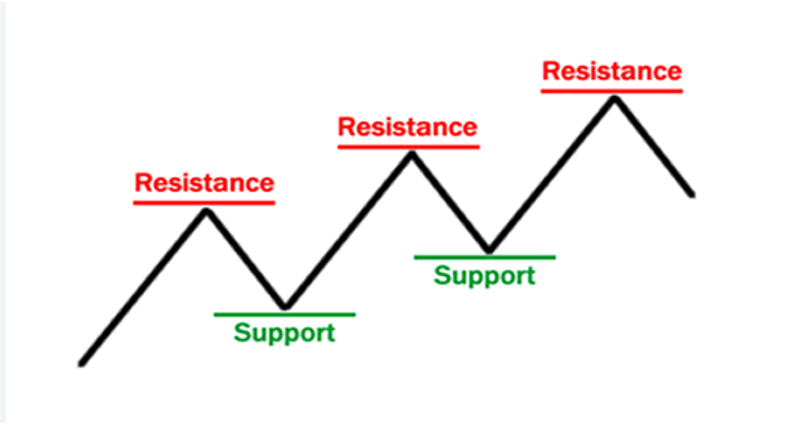
🔹 What is Resistance?
Resistance is the price level where supply is strong enough to stop or reverse the price increase. When the price rises close to the resistance, many sellers enter the market, causing the price to potentially fall.
Characteristics of Resistance:
- Occurs at the area of the previous high.
- The price has been rejected at this level several times.
- If the resistance is broken (breakout), it can turn into a new support.
🔹 Function of Support & Resistance in Trading
- Determines entry and exit areas.
- Determines profit and stop loss targets.
- Confirming chart patterns.
- Used in breakout or reversal strategies.
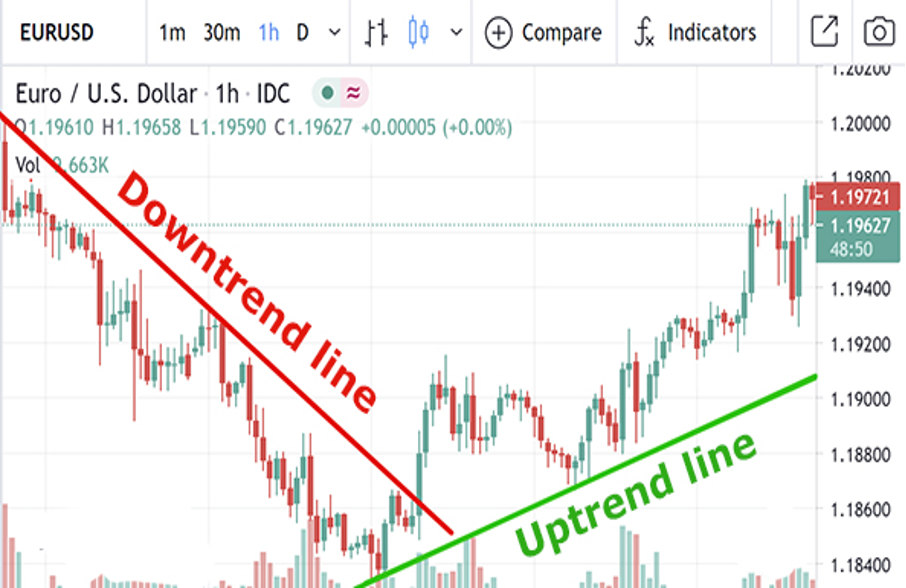
🔹 What is a Trendline?
A trendline is a line used to show the direction of a price trend. Trendlines are drawn by connecting the highest (high) or lowest (low) points in a price movement.
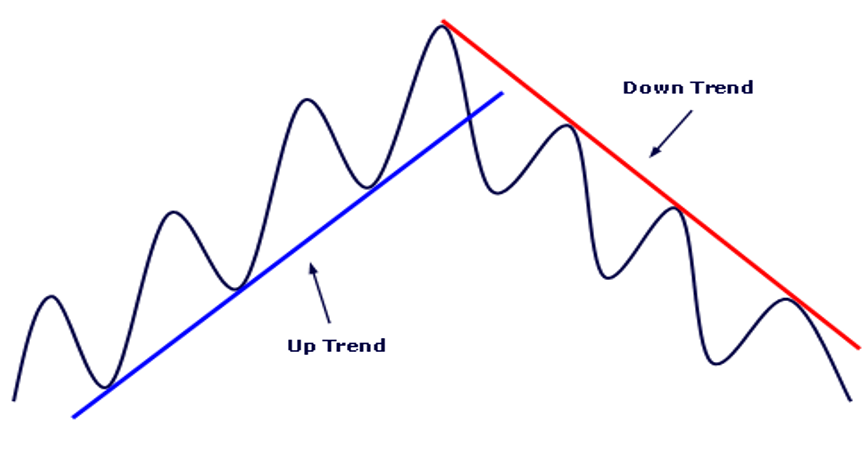
Types of Trendlines:
- Uptrend Line (Bullish):
- Drawn from a low to the next higher low.
- Indicates the price is moving up.
- Downtrend Line (Bearish):
- Drawn from a high to the next lower high.
- Indicates the price is moving down.
🔹 Trendline Function:
- Identifies the direction of market movement (main trend).
- Determines buy areas in uptrends and sell areas in downtrends.
- Used to confirm breakouts or breakdowns.
- Helps to see the price structure (market structure).
🔹 Tips for Using Support, Resistance, and Trendline
- Don’t use single points – use areas (zones) instead of single lines.
- Match it with the time frame you’re using.
- Combine with other indicators or candlestick patterns for entry confirmation.
- Watch the price reaction in that area – is there a rejection, fakeout, or breakout?
The best investment is an investment in knowledge. Start your journey to trading success with a Masterclass Trading Webinar every Friday. Join now!