


In the world of trading, understanding price movements is not just about numbers, but also reading the story behind the chart. One of the most popular methods of visualizing price movements is candlestick charts. Candlestick patterns can provide important signals about the next direction of market movement.
1. What is a Candlestick?
Candlesticks are a form of price chart that shows the opening price, highest price, lowest price, and closing price within a certain period of time.
One candlestick can tell a lot, including the strength of buyers (bulls) and sellers (bears) in the market.
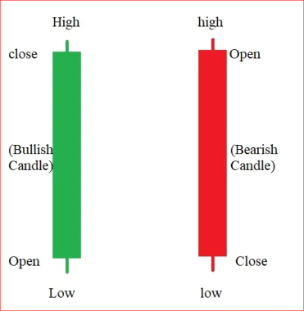
Parts of a candlestick:
- Body → shows the distance between the opening and closing prices.
- Shadow/Wick → shows the highest and lowest prices within the period.
- Warna → bullish candlesticks are usually green/white, while bearish are red/black.
2. Important Types of Candlestick Patterns
Some candlestick patterns that traders must recognize include:
a. Doji
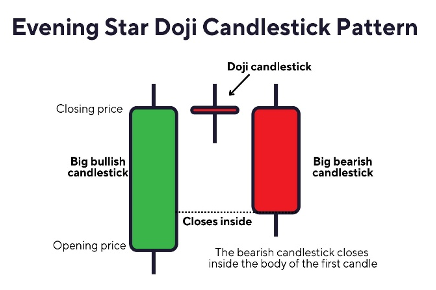
Signaling market indecision. The opening and closing prices are almost the same. Can be a sign of reversal if it appears at the top or bottom of a trend.
b. Hammer & Inverted Hammer
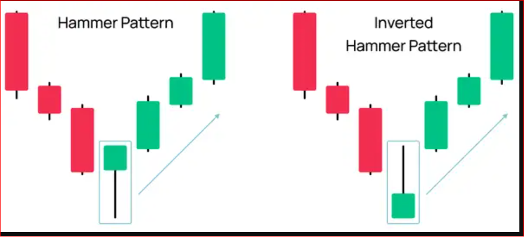
- Hammer → appears at the end of a downtrend, signaling a potential reversal to the upside.
- Inverted Hammer → similar pattern but the tail is on top, also signaling a potential reversal.
c. Engulfing Pattern
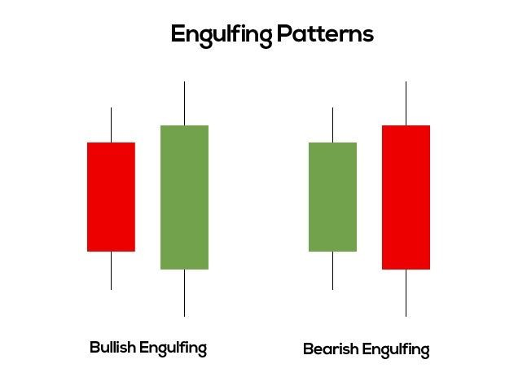
- Bullish Engulfing → a large green candlestick engulfs the previous red candlestick, indicating a bullish reversal.
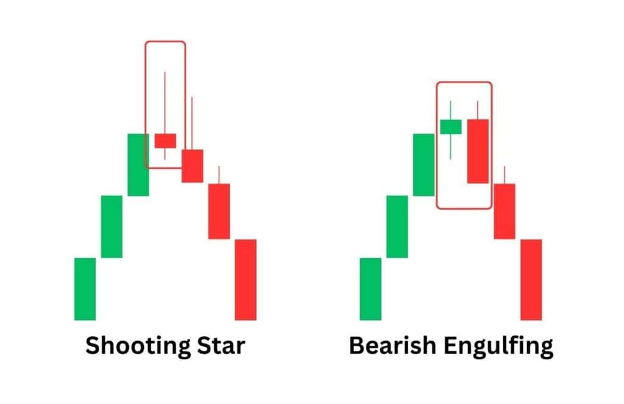
- Bearish Engulfing → a large red candlestick engulfs the previous green candlestick, indicating a bearish reversal.
d. Shooting Star
Muncul di puncak tren naik, dengan ekor panjang di atas body, menandakan potensi pembalikan turun.
3. How to Use Candlestick Patterns
- Confirmation: Don’t just rely on one pattern; combine it with other indicators such as Moving Average or RSI.
- Market Context: Pay attention to the ongoing trend-reversal patterns are stronger if they appear after a clear trend.
- Timeframe: The higher the timeframe (H4, D1), the more valid the signal.
4. Conclusion
Candlestick patterns are the “visual language” of the market that helps traders understand price sentiment and direction. By recognizing key patterns such as Doji, Hammer, Engulfing, and Shooting Star, traders can improve their decision-making accuracy.
Join the Masterclass Trading Webinar to find out more about what are the Important Signals that Traders must know, Click Here!